
Navigating the volatile world of cryptocurrency can be daunting, especially for beginners. This beginner’s guide to understanding crypto market trends will equip you with the essential knowledge to make informed decisions. We’ll explore key factors influencing crypto prices, including Bitcoin‘s dominance, the impact of altcoins, the role of regulation, and the ever-changing landscape of blockchain technology. Learn to identify market cycles, understand technical analysis basics, and develop a strategy for managing risk in this exciting yet unpredictable investment arena. By the end, you’ll have a foundational understanding of how to interpret crypto market signals and approach crypto trading with greater confidence.
How Crypto Market Trends Work

Crypto market trends are driven by a complex interplay of factors, making them notoriously volatile. Supply and demand are fundamental: high demand relative to limited supply pushes prices up, while the opposite leads to price drops. Market sentiment, encompassing investor confidence and fear, significantly impacts price movements. Positive news or technological advancements often fuel bull markets (periods of rising prices), while negative news or regulatory uncertainty can trigger bear markets (periods of declining prices).
Bitcoin, the largest cryptocurrency by market capitalization, often sets the tone for the broader market. Its price fluctuations frequently influence the performance of other cryptocurrencies (altcoins). Technological developments within the crypto space, such as new blockchain protocols or decentralized finance (DeFi) innovations, can also generate significant market interest and price swings. Furthermore, macroeconomic factors, including inflation rates, interest rate changes, and global economic events, play a crucial role in shaping market sentiment and impacting cryptocurrency prices.
Regulation also plays a key role. Government policies and regulations concerning cryptocurrencies can influence investor confidence and accessibility, thereby affecting market trends. Whale activity, which refers to significant trades made by large investors, can cause short-term price volatility. Lastly, social media trends and news coverage can drastically influence market sentiment and create price fluctuations, highlighting the significance of information flow and public perception in the crypto market.
Bull vs Bear Market in Crypto
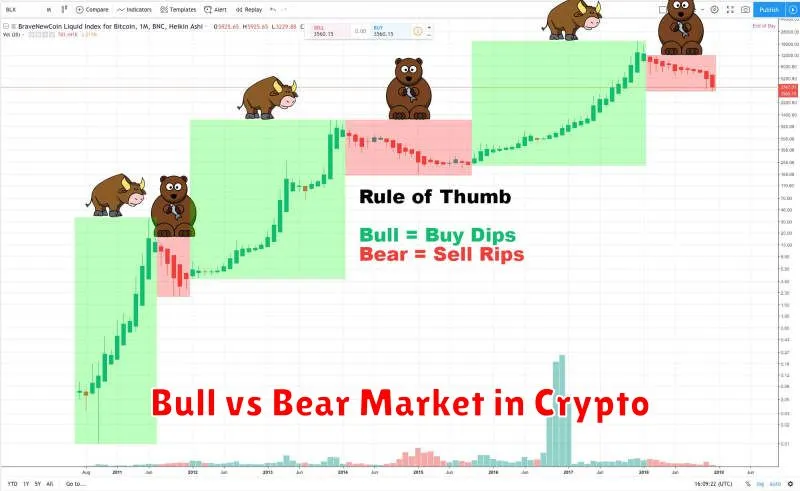
Understanding the difference between bull and bear markets is crucial for navigating the volatile world of cryptocurrency. A bull market is characterized by rising prices and widespread optimism. Investors are confident, buying assets in anticipation of further price increases. This period is often associated with high trading volume and significant price appreciation.
Conversely, a bear market is defined by falling prices and pessimism. Investors are fearful, selling assets to minimize losses. This typically leads to lower trading volumes and significant price drops. Bear markets can last for extended periods, creating challenging conditions for investors.
Identifying the current market trend is essential for informed decision-making. While bull markets offer opportunities for substantial profits, they also carry the risk of sharp corrections. Bear markets present challenges, but they can also offer opportunities for buying assets at discounted prices for long-term investors. It’s important to remember that crypto markets are highly speculative and unpredictable, and both bull and bear markets can be followed by periods of consolidation or sideways trading.
Reading Candlestick Charts
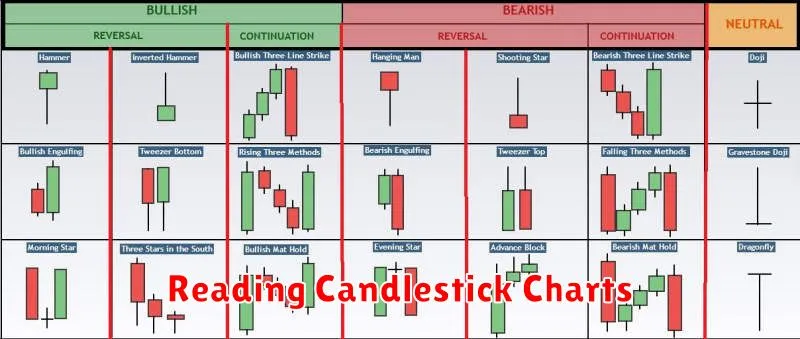
Candlestick charts are a fundamental tool for analyzing price movements in the crypto market. Each candlestick represents a specific time period (e.g., 1 hour, 1 day), showing the opening, closing, high, and low prices.
A green (or white) candlestick indicates a closing price higher than the opening price, signifying a bullish period. Conversely, a red (or black) candlestick shows a closing price lower than the opening price, indicating a bearish period. The body of the candlestick represents the range between the opening and closing prices, while the wicks (or shadows) extend to the high and low prices of the period.
Analyzing candlestick patterns, such as hammers, dojis, and engulfing patterns, can help identify potential price reversals or continuations. However, it’s crucial to remember that candlestick patterns are most effective when used in conjunction with other technical indicators and analysis methods. They provide valuable insights into short-term price fluctuations but should not be the sole basis for trading decisions.
Understanding candlestick chart patterns requires practice and experience. Begin by focusing on identifying the basic elements (open, close, high, low) and gradually progress to recognizing more complex patterns. Combining this with other forms of analysis will provide a stronger basis for informed market decisions.
Using Technical Indicators for Trading
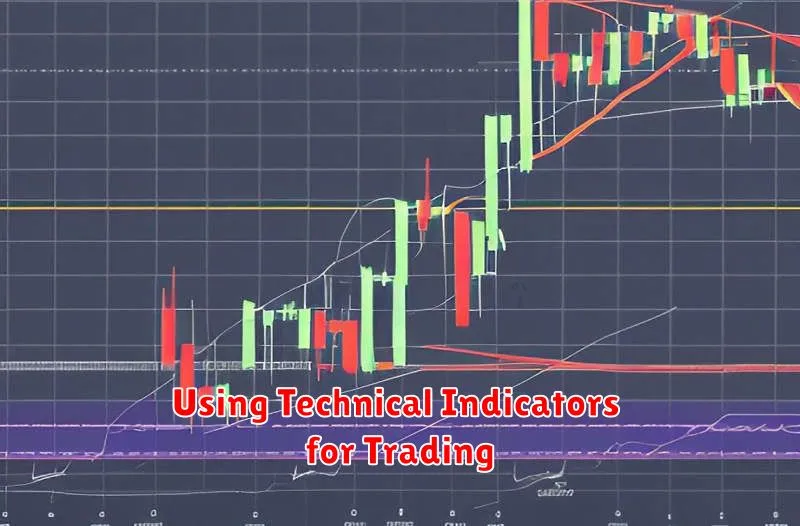
Technical indicators are mathematical calculations based on price and volume data, designed to help predict future price movements. They don’t guarantee profits, but can offer valuable insights when used correctly in conjunction with other forms of analysis.
Moving Averages (MAs) are among the most popular. They smooth out price fluctuations, highlighting potential support and resistance levels. Simple Moving Averages (SMAs) and Exponential Moving Averages (EMAs) are common types, each with its own strengths and weaknesses.
Relative Strength Index (RSI) measures the magnitude of recent price changes to evaluate overbought or oversold conditions. Readings above 70 often suggest an overbought market, while readings below 30 might indicate an oversold market. However, it’s crucial to consider RSI in context with other indicators.
MACD (Moving Average Convergence Divergence) compares two moving averages to identify momentum changes. Crossovers of the MACD line and signal line can generate buy or sell signals. Divergence between the MACD and price can also provide valuable information.
Bollinger Bands display price volatility using standard deviations. Prices often bounce off the upper and lower bands, providing potential trading opportunities. Wide bands suggest increased volatility, while narrow bands imply low volatility.
It is important to remember that technical indicators are just one piece of the puzzle. Fundamental analysis, risk management, and a thorough understanding of the cryptocurrency market are crucial for successful trading. Never rely solely on indicators for making investment decisions.
Avoiding FOMO and Emotional Trading
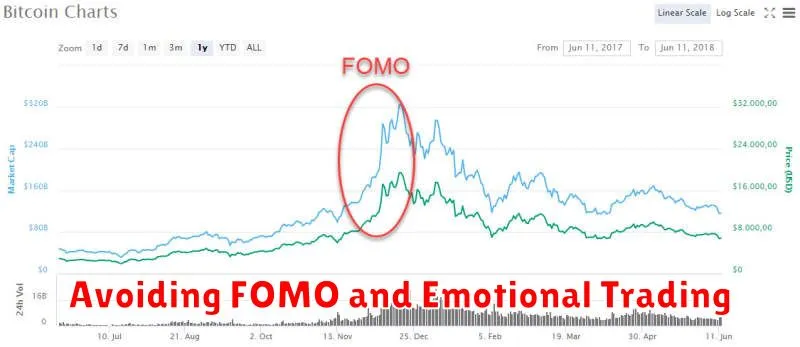
The cryptocurrency market is volatile, leading to frequent emotional reactions from investors. Fear of missing out (FOMO) and emotional trading are significant obstacles to successful investing. FOMO compels impulsive decisions based on short-term price spikes, rather than sound financial strategies.
Emotional trading, driven by fear, greed, or excitement, often results in poor investment choices. Making decisions based on gut feelings instead of data-driven analysis increases risk.
To avoid these pitfalls, develop a well-defined investment strategy. This includes setting clear financial goals, determining your risk tolerance, diversifying your portfolio, and adhering to your plan regardless of market fluctuations. Regularly reviewing your portfolio and sticking to your strategy are crucial.
Patience and discipline are key. Resist the urge to react instantly to market changes. Remember that cryptocurrency markets are prone to significant price swings; avoid impulsive trades based on short-term price movements. Instead, focus on long-term growth and your established investment plan.
Consider setting stop-loss orders to mitigate potential losses and protect your investment. This automated order will sell your assets if the price falls to a predetermined level, limiting potential damage from emotional decisions.
Finally, stay informed but avoid excessive exposure to market news and social media commentary. These sources can fuel emotional responses and lead to rash decisions. Focus on your strategy and long-term goals.